
I have developed a greater appreciation for data and and security since being introduced to data analytics. It was a new way of thinking for me in terms of what kinds of information could be gathered and what could be done with that information. Below is a “cheat sheet” I created on Network Text Analysis to explain it in terms anyone could understand.
Network Text Analysis
Network Text Analysis is a method of text mining that works much like a multi-layered mind map. Text is connected to other texts to show relationship between them. People or groups can also be connected to text to show interaction. As a whole, this looks much like a spider-web of connections. Texts or people are usually represented as points on the web or ‘nodes.’ Data sources or people can also be represented by using different colors. The more text and interactions there are, the more complex the network looks.
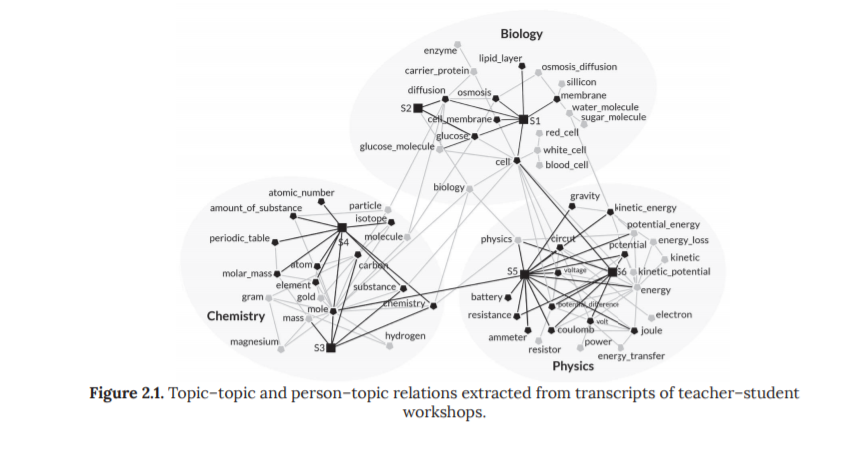
Analysis of this web can occur in different ways, but it usually involves reshaping the network in some way. One way is to select only one or two types of nodes to focus on. This allows you to filter out some noise to see specific connections. Another way is to cluster or group nodes together to see what contexts or topics emerge. Graphically, this can be represented by circles encompassing a group of nodes (see figure below from Hoppe). Yet another way is to analyze the network for the frequency of the occurrence of a text or how often texts occur together, which can be depicted by a larger sized node. Nodes can also be timestamped, which allows for chronological analysis (as in who said what first).
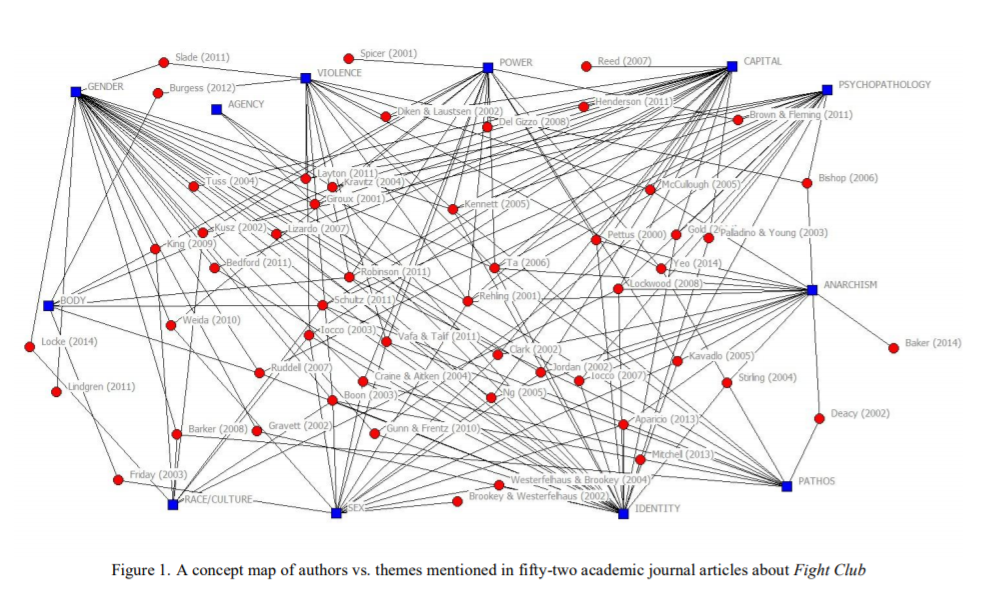
The goal of network text analysis is to determine key words or themes in a group of text-based information. For example, Hunter and Singh (2015) used NTA to find the key themes of Fight Club based on academic work on Fight Club.
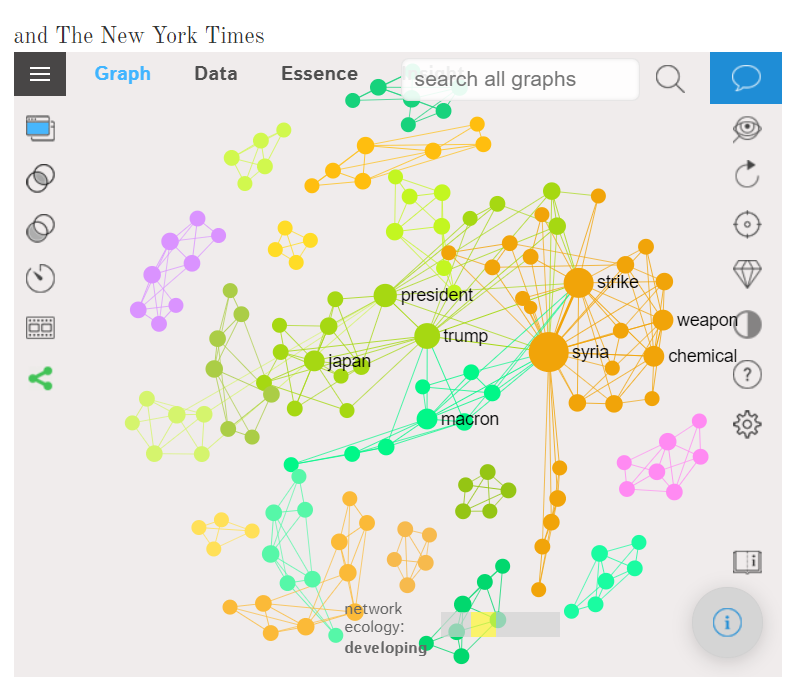
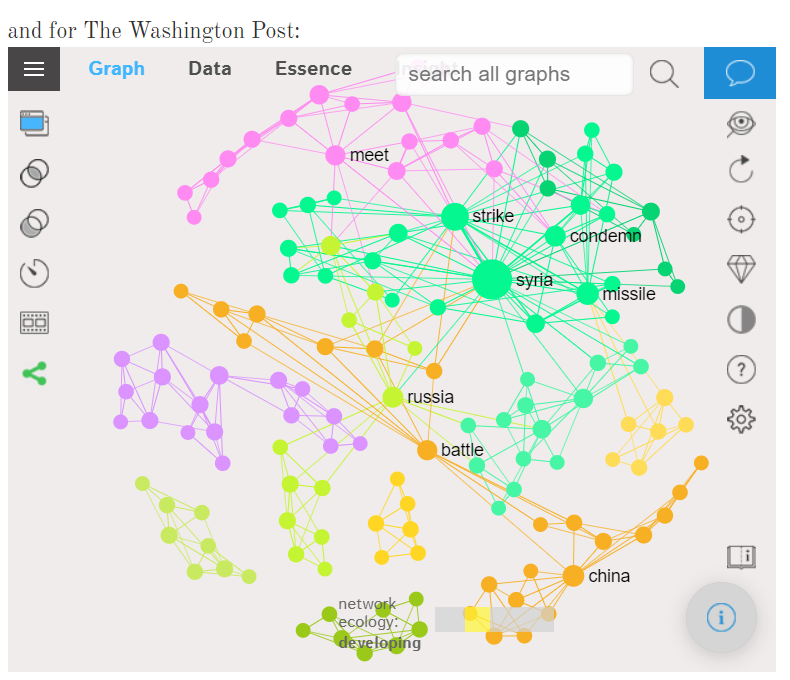
Network text analysis can also highlight key relationships between words or positions of people in the network. In addition, comparison of different networks on the same topic is possible. In the networks below, you can compare how two newspapers, The New York Times and The Washington Post, cover current events on the same day.
In the realm of education, many learning questions can be answered by network text analysis. By using it to analyze and compare student text-based responses, teachers could look to see which key terms or topics area students are answering with, which could correlate to their understanding of these concepts. Depth of understanding might be represented by how many connections a student can make with the key terms. It can also provide teachers with feedback as to which concepts are not represented in the text network. This could be due to a learning gap in student understanding that the teacher can address. In online learning situations, NTA can help educators correlate learning resources with student responses. For example, educators can see which keywords students are using after watching which videos. This course-level data allows the educator to evaluate the learning process and make course design changes if necessary.
NTA can also work with Social Network Analysis (SNA), like Threadz. This can also allow teachers to see who is contributing to discussions as well as how often, which lends itself as a quantitative measure of participation. Teachers can follow up with students that are under represented in the network to see if they are struggling. In addition, teachers can see which students are connected to each other by common text and how the discussion has progressed. This can be an indicator of the amount of learner engagement with the content and how learners are engaging with each other.
References:
News Analysis Using Text Network Visualization of RSS Feeds
A Network Text Analysis of Fight Club
Hoppe, H. U. (2017). Chapter 2. Computational Methods for the Analysis of Learning and Knowledge Building Communities. In Charles Lang, George Siemens, Alyssa Wise & Dragan Gašević (Eds.), Handbook of Learning Analytics (First Edition), pp. 23-33. Society for Learning Analytics Research.